FTMO Prop Trading: Qualification, Risk Limits, and Realistic Profit Expectations (2026)
Proprietary trading firms offer funded accounts to traders who prove their skills—no capital required upfront. FTMO is the largest and most established prop firm, having paid out over $200 million to traders. But understanding the actual economics—qualification requirements, risk limits, and realistic profit potential—is essential before pursuing this path.
What is FTMO?
FTMO is a Czech-based proprietary trading firm founded in 2015. They provide funded trading accounts up to $200,000 to traders who pass their evaluation process. You trade their capital and keep 80-90% of profits, while they absorb the losses.
Key facts:
- Account sizes: $10K, $25K, $50K, $100K, $200K
- Profit split: 80% (upgrades to 90% with scaling)
- Markets: Forex, indices, commodities, crypto, stocks
- Platforms: MetaTrader 4/5, cTrader, DXtrade
- Payout frequency: Bi-weekly (every 14 days)
The FTMO Challenge: Two-Phase Evaluation
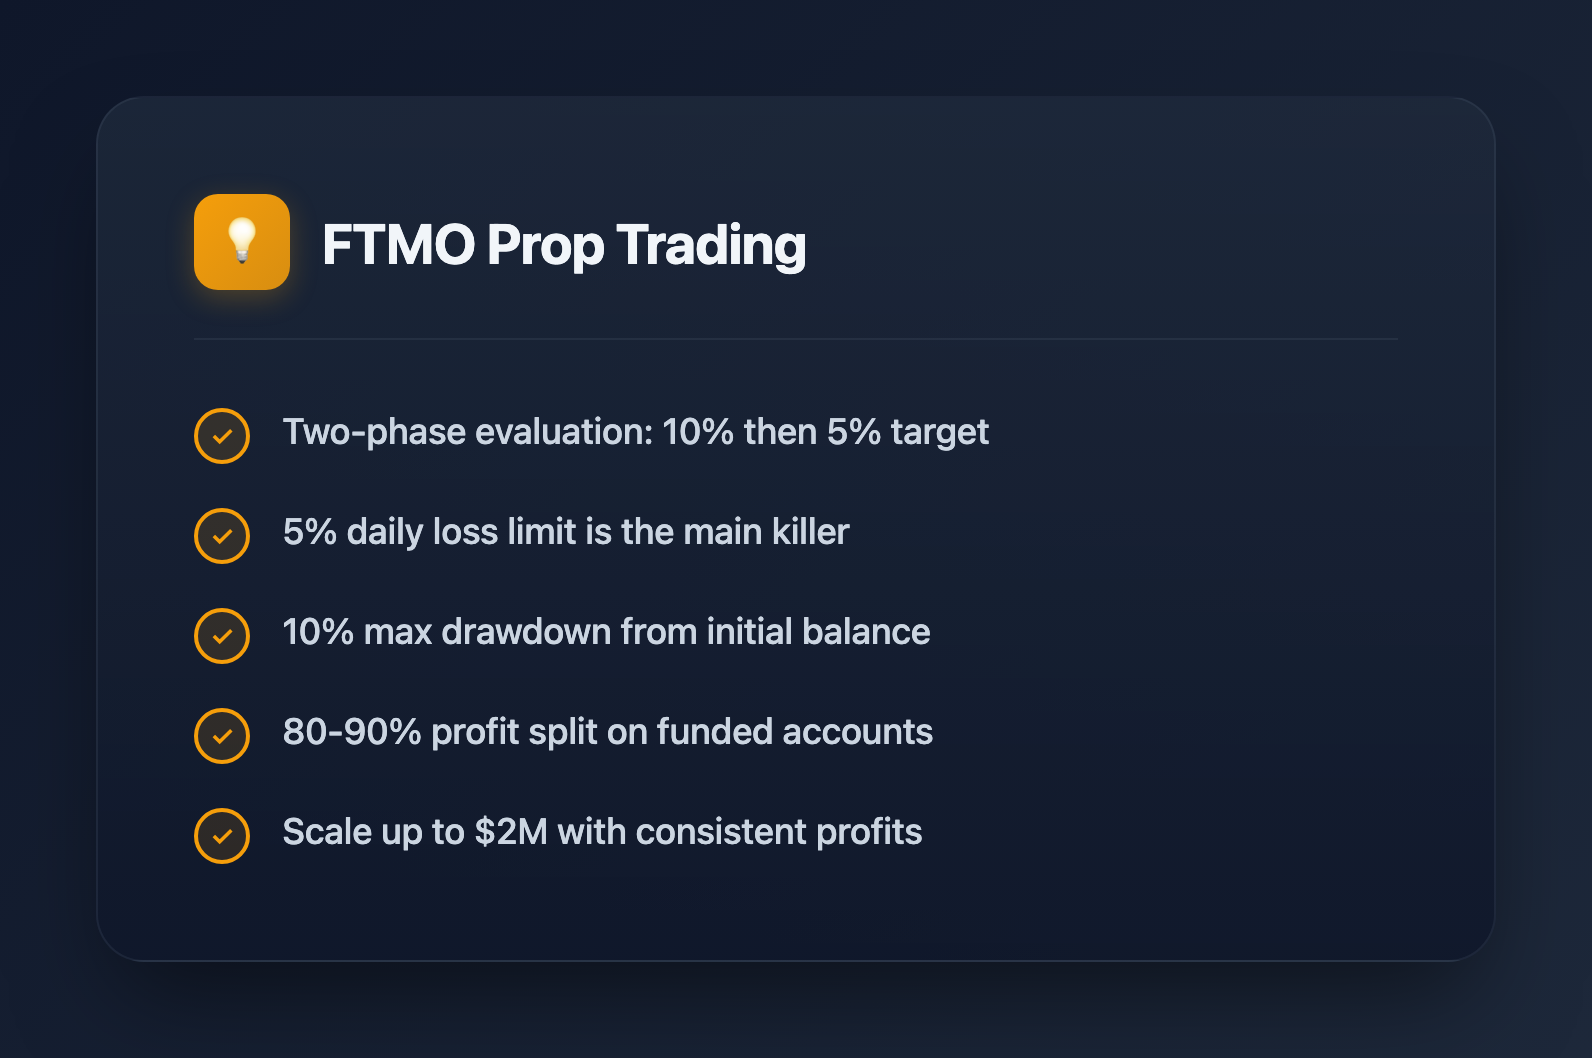
To get funded, you must pass a two-step evaluation that tests both profitability and risk management.
Phase 1: FTMO Challenge
| Account Size | Challenge Fee | Profit Target | Max Daily Loss | Max Total Loss | Time Limit |
|---|---|---|---|---|---|
| $10,000 | $155 | $1,000 (10%) | $500 (5%) | $1,000 (10%) | Unlimited* |
| $25,000 | $250 | $2,500 (10%) | $1,250 (5%) | $2,500 (10%) | Unlimited* |
| $50,000 | $345 | $5,000 (10%) | $2,500 (5%) | $5,000 (10%) | Unlimited* |
| $100,000 | $540 | $10,000 (10%) | $5,000 (5%) | $10,000 (10%) | Unlimited* |
| $200,000 | $1,080 | $20,000 (10%) | $10,000 (5%) | $20,000 (10%) | Unlimited* |
*Must trade minimum 4 days. Previously had 30-day limit, now unlimited.
Phase 2: Verification
Same rules but with a reduced profit target:
- Profit target: 5% (half of Phase 1)
- Daily loss limit: 5% (same)
- Total loss limit: 10% (same)
- Minimum trading days: 4
Pass Rate Reality
FTMO publishes their statistics. The overall pass rate is approximately 10-15%:
- Phase 1 pass rate: ~25-30%
- Phase 2 pass rate: ~50-60%
- Combined: ~15% of all attempts result in funding
Most failures occur due to hitting the daily or total loss limit, not missing profit targets.
Understanding the Risk Limits
Daily Loss Limit (5%)
This is the maximum you can lose in a single trading day. It's calculated as:
Daily Loss = Starting Balance of Day - Current EquityCritical nuances:
- Includes both realized losses AND floating (unrealized) losses
- Resets at midnight server time (CE(S)T)
- If you're up $2,000 on a $100K account, you can lose up to $7,000 that day before breach
Example: You have a $100K account (5% daily = $5,000 limit). You start the day flat, enter a trade, and it goes against you by $5,001—you're immediately breached, even if you close the trade at a smaller loss.
Maximum Loss Limit (10%)
The total loss limit from your initial starting balance:
Max Loss = Initial Balance - Lowest Equity PointKey points:
- Calculated from original balance, not current balance
- Never resets—it's cumulative across your entire evaluation
- Once breached, the account is permanently failed
Example: $100K account, 10% max = $10,000 buffer. If equity ever drops below $90,000, you fail immediately.
Position Sizing Based on Risk Limits
Understanding these limits determines your maximum position size:
// For a $100,000 account:
// Daily limit: $5,000
// Per-trade risk (2% of daily): $100 to stay safe

// If your stop loss is 20 pips on EUR/USD:
// Standard lot (100k units) = ~$10/pip
// Max lots = $100 / ($10 × 20) = 0.5 lots

// Conservative approach: risk 1% of daily limit per trade
// Allows for 5 losing trades before daily breach
The Funded Account: What You Actually Trade
After passing both phases, you receive a funded account. But what are you actually trading?
Real vs Simulated Capital
FTMO funded accounts are simulated accounts connected to real market data. Your trades don't execute in the real market—FTMO uses a liquidity bridge that mimics real execution. This is standard across most prop firms.
Why this matters:
- Execution is generally better than real markets (no slippage on small positions)
- You're essentially trading a demo account with real profit-sharing
- FTMO may hedge your positions in real markets, but that's their risk management
Profit Split and Payouts
- Standard split: 80% to trader, 20% to FTMO
- Scaling plan: After 4 months of profitable trading, you can upgrade to 90% split
- Payout cycle: Every 14 days (request within first 14 days of cycle)
- Minimum payout: No minimum—you can withdraw any profit
- Payment methods: Bank transfer, Skrill, crypto
Calculating Your Actual Trading Size and Profit
Realistic Position Sizing
With a $100,000 FTMO account, you don't trade like you have $100K. Risk management dictates much smaller effective positions:
| Account Size | Daily Loss Limit | Safe Risk/Trade (1%) | Typical Position Size |
|---|---|---|---|
| $10,000 | $500 | $50 | 0.05-0.25 lots |
| $25,000 | $1,250 | $125 | 0.1-0.5 lots |
| $50,000 | $2,500 | $250 | 0.25-1.0 lots |
| $100,000 | $5,000 | $500 | 0.5-2.0 lots |
| $200,000 | $10,000 | $1,000 | 1.0-4.0 lots |
*Position size varies based on stop loss distance. Assumes 20-50 pip stops on forex.
Realistic Monthly Profit Expectations
Consistent profitability, not home runs, is the goal:
| Account Size | Monthly Return 5% | Your Share (80%) | Monthly Return 10% | Your Share (80%) |
|---|---|---|---|---|
| $10,000 | $500 | $400 | $1,000 | $800 |
| $25,000 | $1,250 | $1,000 | $2,500 | $2,000 |
| $50,000 | $2,500 | $2,000 | $5,000 | $4,000 |
| $100,000 | $5,000 | $4,000 | $10,000 | $8,000 |
| $200,000 | $10,000 | $8,000 | $20,000 | $16,000 |
Reality check: Making 5-10% monthly consistently is extremely difficult. Most professional traders average 2-5% monthly. Expect significant variance—some months negative, others positive.
The Scaling Plan
FTMO's scaling plan increases your account size and profit split over time:
- Requirements: 10% profit over 4-month period with at least 2 profitable months
- Benefits: 25% account size increase + 90% profit split
- Maximum scale: Up to $2,000,000 account size
Example progression: $100K → $125K → $156K → $195K → ... → $2M
FTMO vs Other Prop Firms
| Firm | Max Account | Profit Split | Evaluation Cost | Profit Target | Notable Features |
|---|---|---|---|---|---|
| FTMO | $200K (scales to $2M) | 80-90% | $155-$1,080 | 10% + 5% | Most established, free retakes |
| Funded Next | $200K | 80-90% | $32-$999 | 10% + 5% | Cheaper, fast payouts |
| The5ers | $4M | 50-100% | $95-$850 | 6-10% | Instant funding option, scaling to $4M |
| MyForexFunds | — | — | — | — | Shut down by regulators (2023) |
| True Forex Funds | — | — | — | — | Shut down (2023) |
Warning: Multiple prop firms have shut down suddenly, leaving traders unpaid. FTMO's longevity and transparent payouts make it lower risk, but no prop firm is guaranteed to survive.
Strategies That Work for Prop Firm Trading
What Works
- Swing trading: Hold positions for days, fewer decisions, lower stress
- Trend following: Let winners run, cut losers quickly
- Session-based trading: Trade specific market sessions (London, NY open)
- Risk-first approach: Never risk more than 1-2% of daily limit per trade
What Doesn't Work
- Martingale/averaging down: One bad trade can breach limits
- News trading: Slippage and volatility hit daily limits fast
- Overtrading: More trades = more chances to breach daily limit
- Revenge trading: Trying to recover losses leads to emotional decisions
The Math of Survival
// To survive long-term, you need:
// Win rate × Average Win > Loss rate × Average Loss

// Example: 50% win rate
// If average loss = $200, average win must be > $200
// Minimum R:R of 1:1 at 50% win rate just breaks even

// Better: 40% win rate with 2:1 R:R
// 40% × $400 (2R) = $160 expected per trade
// 60% × $200 (1R) = $120 expected loss
// Net: +$40 expected per trade

// This is why risk management > win rate
Common Mistakes and How to Avoid Them
1. Oversizing Early in the Challenge
Traders often take large positions to hit the 10% target quickly, then breach daily limits. Instead, trade normal size and let compound gains accumulate.
2. Ignoring the Daily Limit
The daily limit is the killer. If you're down 3% for the day, stop trading. Many failures happen from trying to recover intraday losses.
3. Trading Without a Plan
Document your strategy, entry rules, exit rules, and position sizing before starting. Don't make decisions in the heat of the moment.
4. Forcing Trades Near Target
At 9% profit, traders often take excessive risk to hit 10%. This is where many blow accounts. Be patient—the target isn't going anywhere.
Is FTMO Worth It?
Pros
- Trade significant capital without personal risk
- Keep majority of profits (80-90%)
- Structured risk management forces discipline
- Can scale to $2M+ over time
- Legitimate company with long track record
Cons
- ~85% of traders fail the evaluation
- Challenge fees add up if you fail repeatedly
- Strict rules can lead to breaches from minor mistakes
- Not real market execution (simulated)
- Prop firm industry has regulatory uncertainty
Who Should Try FTMO?
- Traders with proven strategies on personal accounts
- Those who can demonstrate 6+ months of consistent profitability
- Disciplined traders who can follow strict risk rules
- People who understand the challenge fee is an "education cost" they may lose
Who Should Avoid FTMO?
- Complete beginners—learn to trade profitably first
- Traders with gambling tendencies
- Anyone who can't afford to lose the challenge fee
- Those seeking "get rich quick" outcomes
Conclusion
FTMO offers a legitimate path to trading significant capital without personal financial risk. But the statistics don't lie—85% fail. Success requires an already-profitable strategy, strict discipline around daily limits, and realistic expectations. The traders who succeed treat the evaluation as a normal trading period, not a sprint to hit targets. If you have a proven edge and iron discipline, FTMO can accelerate your trading career. If you're still developing, focus on consistent profitability with your own capital first.